YOuTUBE & the voice: A data Analysis
Digital Media Analytics | Data Visualisations | 2024
The brief & Background
This project called for an analysis of YouTube data collected on the Australian Voice Referendum of 2023.
The Australian Voice Referendum, held in October 14th, 2023, proposed amending the constitution to establish an Indigenous advisory body known as the “Voice to Parliament”. This body would provide a platform for First Nations Australians to offer advice on matters affecting their community.
Despite significant public discussion, the referendum was rejected with the majority of Australians voting “No.”
The outcome sparked reflections on race relations and the ongoing struggle for Indigenous rights and recognition in Australia.
This analysis and report explored the discussion surrounding the The Voice, using YouTube metadata and comments collected from 483 videos over 99 different channels who address the discourse surrounding The Voice referendum.
For this project I started with research about the topic, establishing the context for the report and analysis. I researched the referendum as an overarching topic then narrowed down my research to be more precise for the dataset I was analysing.
Here I outlined how the referendum sparked an intense debate across Australia with debates for both the “Yes” and “No” vote.
I also looked at the culturally significant events during the time period that the dataset was collected from. In particular this was a event called The Garma Festival. This festival is the largest Indigenous gathering in Australia and has become a key event for the discussion of issues affecting the Indigenous communities of Australia.
Next I looked into how social media and politics intertwine, noting how social media sites how become a critical platform for political engagement, both between citizens and politicians alike.
Lastly I outlined how YouTube, provides a platform for political debate and it user reach both within Australia and globally. Additionally, I spoke to how engagement is driven through likes, comments, shares, and subscriptions, offering a wide variety of metrics to measure engagement from.
Research
The data collected for this report was public data that did not need OAuth 2.0. The data used for the analysis were likes, comments, time the video was published and the times of highest engagement, duration and title of videos and thematic analysis of the channels.
The report used a mixed methods approach, combining two analysis tools. The first being Tableau 2024.2.1 for general engagement analysis and the second is Leximancer using LexiDesktop 5, engine 5.0.166. Leximancer uses Natural Language Processing (NLP) to analyse the textual content.
The data was originally in the form of four datasets. Two datasets included the YouTube metadata and another two with the comment data.
The data was joined in Tableau and was analysed as both a single set of data and as divided by the date of the Garma Festival. The Tableau analysis used the metadata to create necessary visualisations.
Using Leximancer, the comment data was imported into the engine which examined the body of text. From the list of terms produced, the engine items where combined and removed as necessary. For example, two counts of the term ‘vote’ were combined and the term ‘br’, representing a break in the raw data, so this term was also removed. This was done twice to capture both a before and after Garma Festival thematic analysis.
collection & Methodology
Results & Visualisations


Next I focused on the videos published per week, focusing on significant events and announcements that aligned with the referendum.
I took note of four main events that correlated with peaks in the data. The initial peak was during the week of the 2022 Garma Festival as the referendum was referenced during that time.
The next three spikes in the data were of interest as they aligned with several important political moments.These events were the announcement of the text of the question on the referendum ballot, the passing of the bill in the House of Representatives and the 2023 Garma Festival.

The first analysis I focused on was general engagement before and after the Garma Festival. For this I used two horizontal bar graphs that showed the count of likes, comments and views on the top videos.
For this visualisation, the most important analysis was based on the time period that the data was collected over. When contrasting each figure, After Garma showed a lower engagement rate, however when the numbers where averaged out day by day the engagement after Garma was significantly higher than before Garma.

The public’s engagement followed the same trend as the videos published.
Although this seemed repetitive of pervious data it was important to note that the social media coverage of the referendum was being engaged with by the public. The engagement with this media helped shaped the public opinion and sentiment of the referendum.
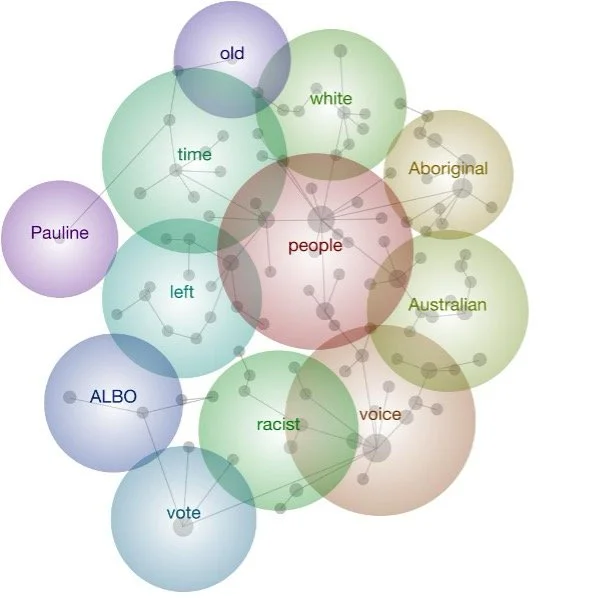
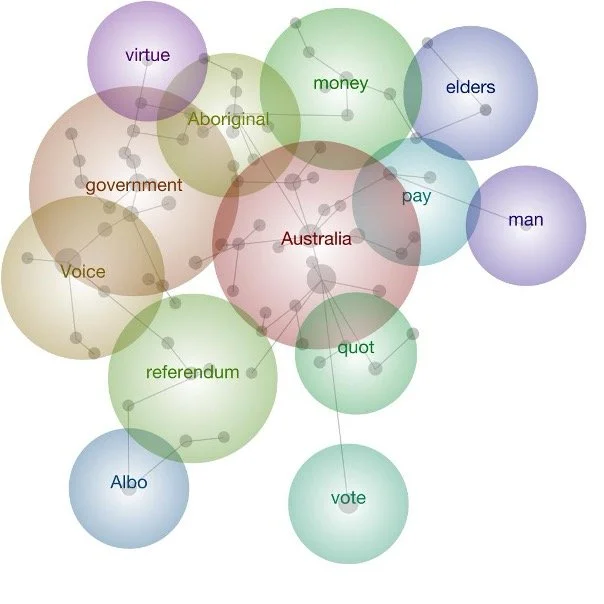
Lastly I did a thematic analysis using Leximancer. I used a side by side analysis to compare how the discourse changed from before and after the Garma Festival.
From this analysis I noted what themes appeared the largest and what they were most connected too. This method enabled conclusions such as a key theme being ‘time’ which was connected to concepts such as ‘look’, ‘doing’, ‘take’ and ‘stop’ insinuating continual calls to action within the comments asking users to take more action surrounding the referendum.